Lending Highlights
2024
1988-2024
Number of Loans Closed
100
Number of Loans Closed
2,369
Number of Loans Closed
Dollar of Loans Closed
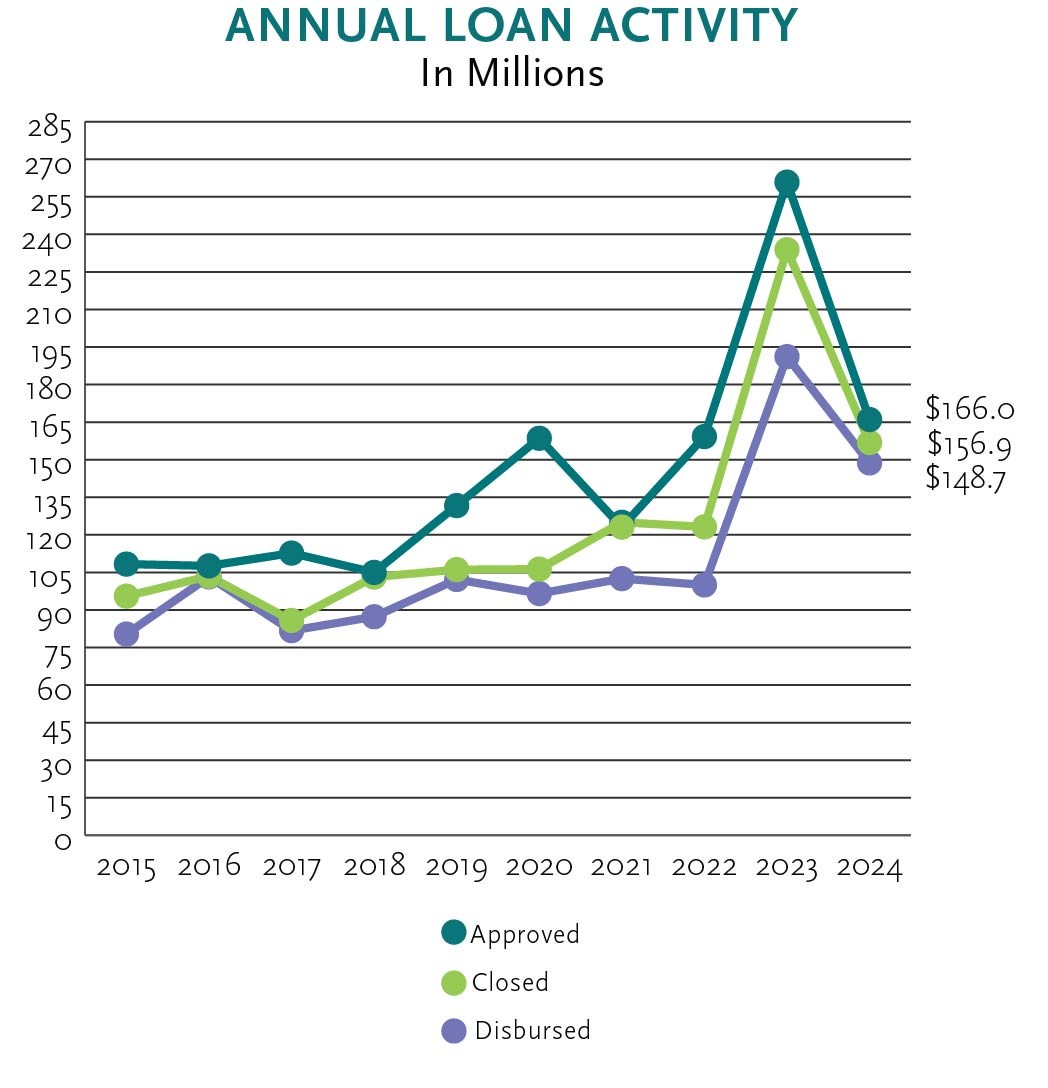
$156.9 million
Dollar of Loans Closed
$1.8 billion
Dollar of Loans Closed
Capital Leveraged
$640 million
Capital Leveraged
$6.7 billion
Capital Leveraged
Number of Nonprofits Served
87
Number of Nonprofits Served
1,282
Number of Nonprofits Served
Square Feet of Real Estate Developed by Financing
2.5 million
Square Feet of Real Estate Developed by Financing
43.7 million
Square Feet of Real Estate Developed by Financing