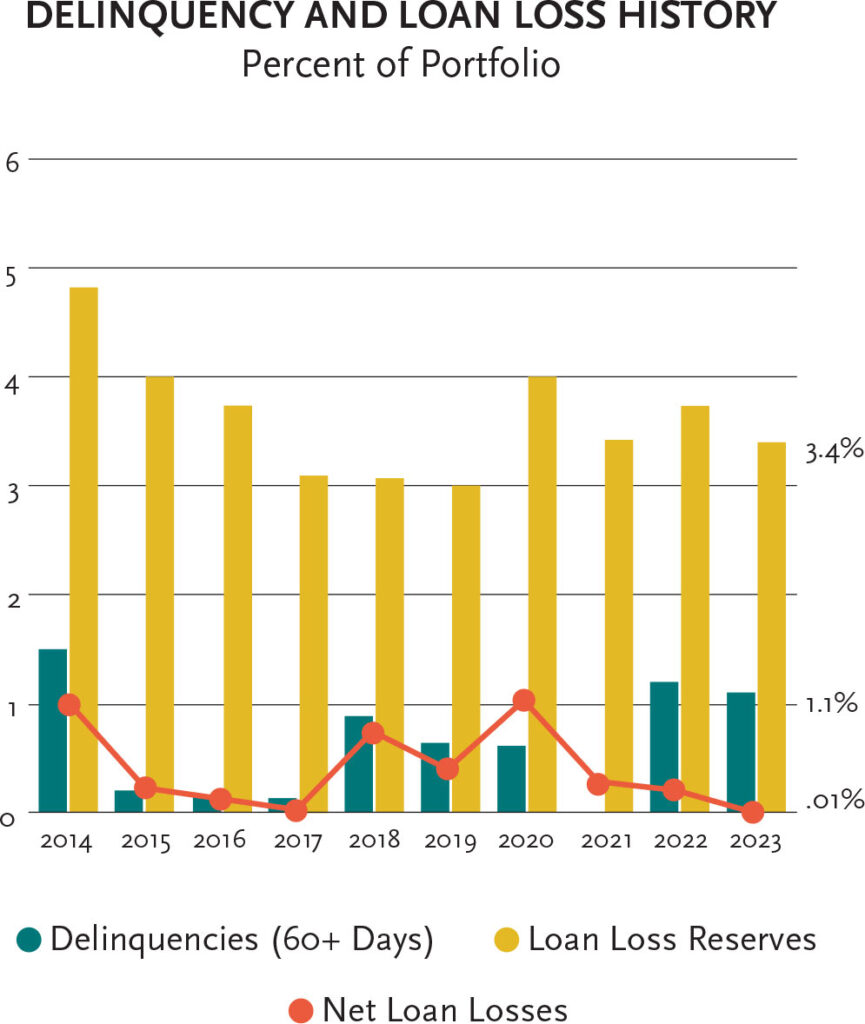
By The Numbers

  • Lending Highlights

    This year, IFF closed more loans to more nonprofits than ever before. These loans – big and small – empower nonprofits to do more for their communities and remain an indispensable component in our continuum for social impact.

    The map below illustrates IFF’s impact over our 35 year history with loans and real estate projects happening across the Midwest.

    2023
    1988-2023
    # Loans Closed
    153
    # Loans Closed
    2,253
    # Loans Closed
    $ Loans Closed
    $233.9 M
    $ Loans Closed
    $1.6 B
    $ Loans Closed
    Capital Leverage
    $1.35 B
    Capital Leverage
    $5.83 B
    Capital Leverage
    # Nonprofits Served
    132
    # Nonprofits Served
    1,207
    # Nonprofits Served
    SF of Real Estate Developed
    4.97 M
    SF of Real Estate Developed
    42 M
    SF of Real Estate Developed
  • Lending Impact Numbers

    When nonprofits have access to flexible financing designed with their needs in mind, they can create safe, inspiring facilities to support their clients and strengthen their communities.

    2023
    1998-2023
    Student seats
    1,332
    Student seats
    160,956
    Student seats
    Child care slots
    272
    Child care slots
    16,041
    Child care slots
    Housing units created/preserved
    3,290
    Housing units created/preserved
    20,589
    Housing units created/preserved
    New patient visits
    69,371
    New patient visits
    725,598
    New patient visits
  • Loan Portfolio

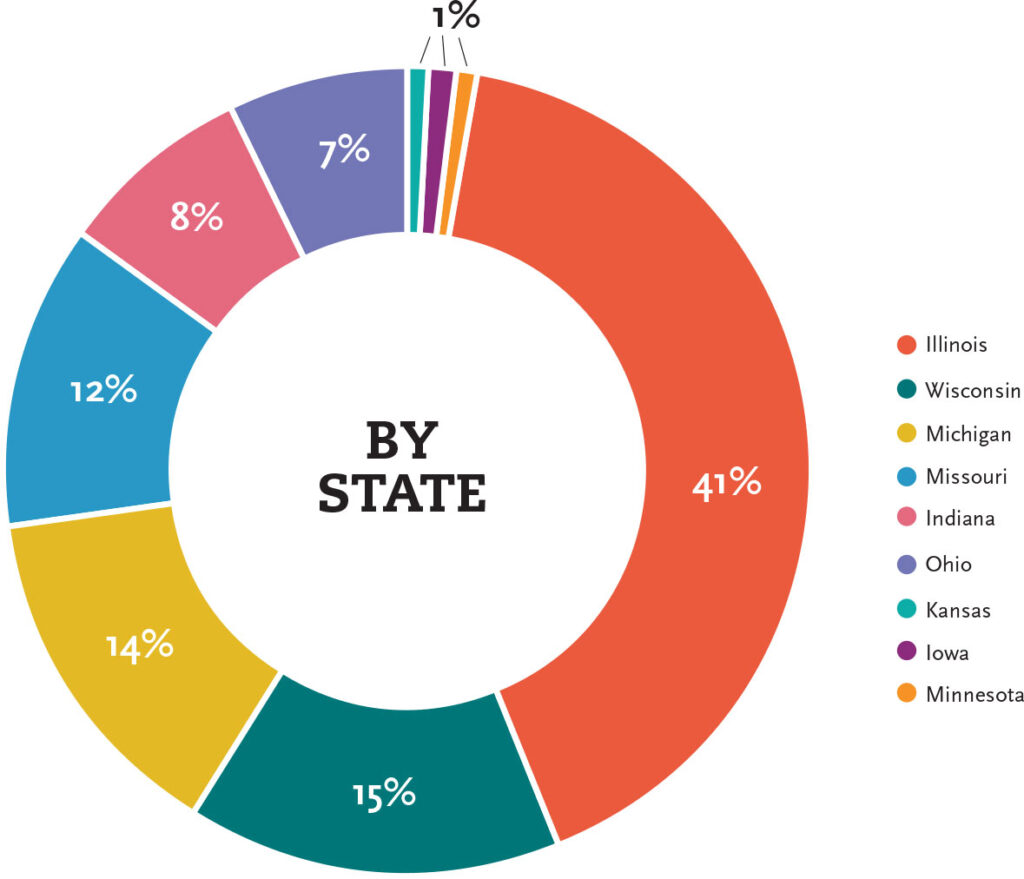
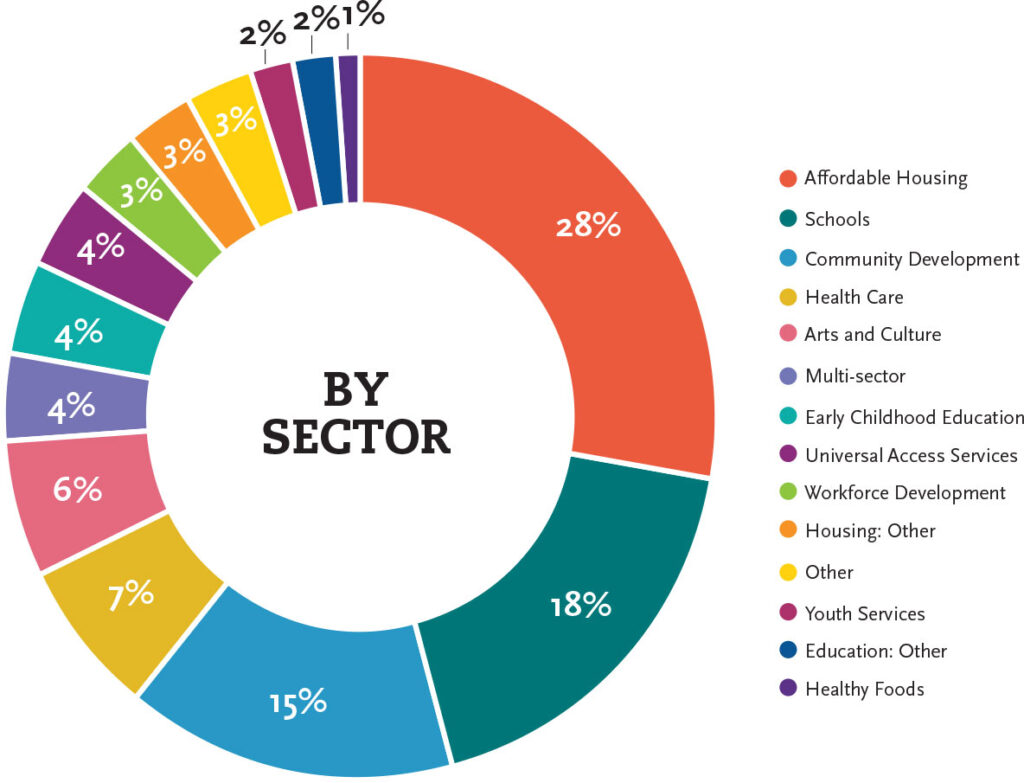
    Our commitment to supporting the full range of nonprofits across the Midwest provides our investors with a well-secured and diversified loan portfolio. These graphs reflect the percentage of dollars in IFF’s portfolio of loans — which, as of Dec. 31, 2023, included 720 loans totaling $559.3 million.

    Included in the figures below are loans made under our innovative New Markets Tax Credit (NMTC) Small Project Loan Pool, which brings the benefits of NMTC financing — low rates and seven-year, interest-only payments — to smaller nonprofit projects throughout the Midwest.

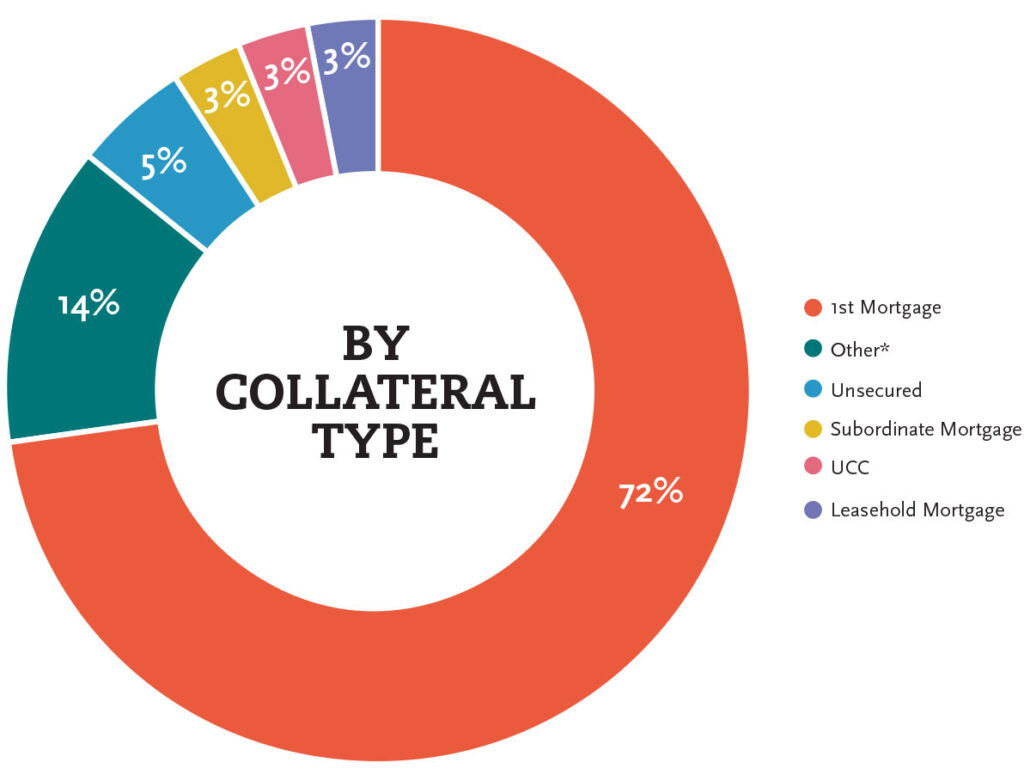
  • *The vast majority of “other” represents NMTC transactions where IFF generally has an indirect interested in the collateral due to the program’s structuring requirements.

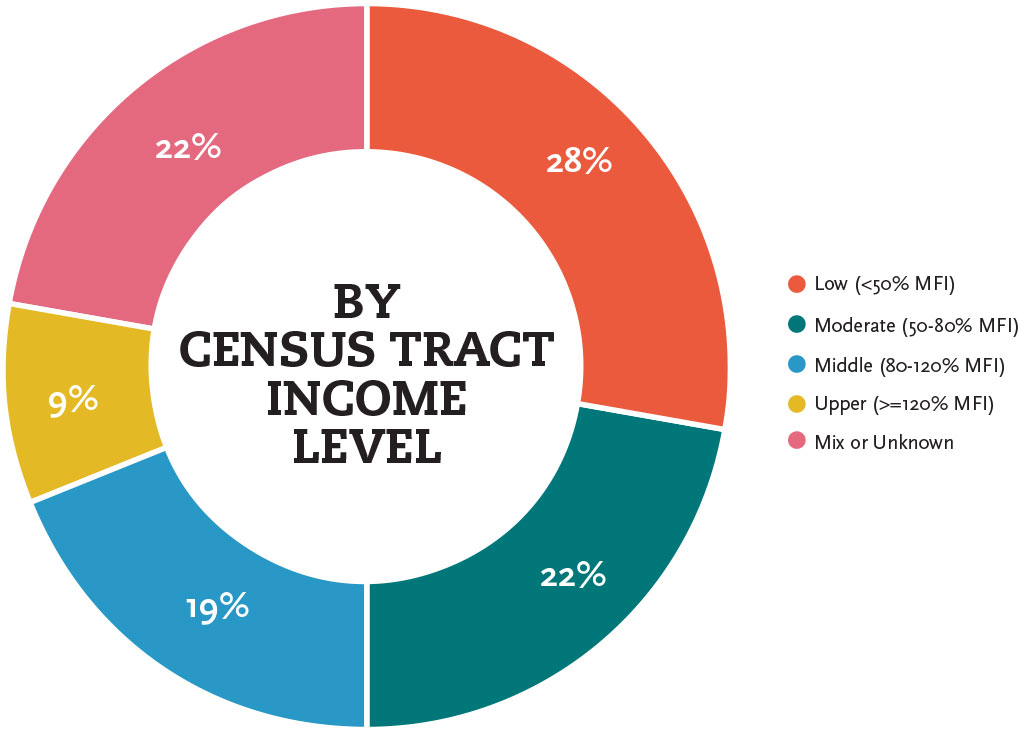
    Data gathered by the U.S. Census and other federal agencies/programs — notably the Community Reinvestment Act, Housing and Urban Development, and Home Mortgage Disclosure Act — have transitioned to these new labels from income level. While the labels have changed, the percentages based on Median Family Income (MFI) have remained the same; what were “very low” and “low” are now “low” and “moderate."

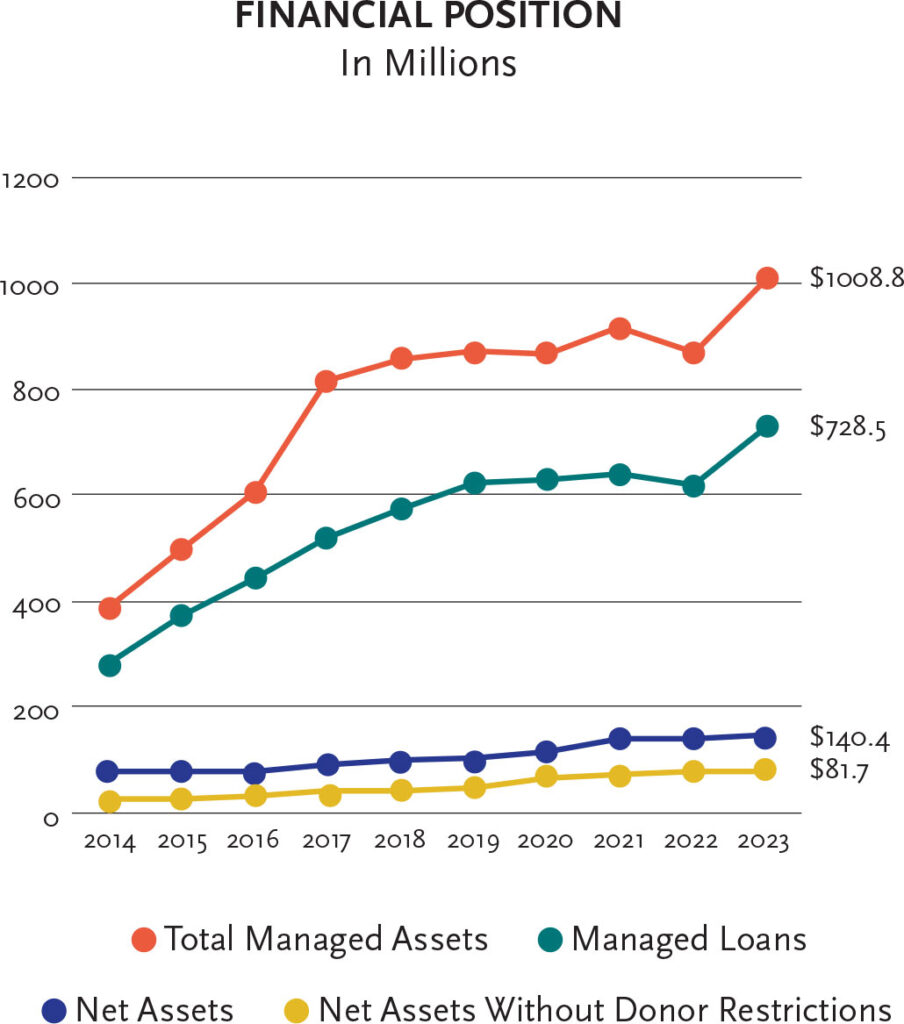
  • Financial Performance

    Ensuring a financially strong IFF is key to maximizing our ability to best deliver on our mission. In 2023, IFF continued to maintain a strong track record of performance. Rated four-star, AAA+ from AERIS, positioning IFF as one of the handful of CDFIs in the country to merit this top rating for both impact and financial condition.

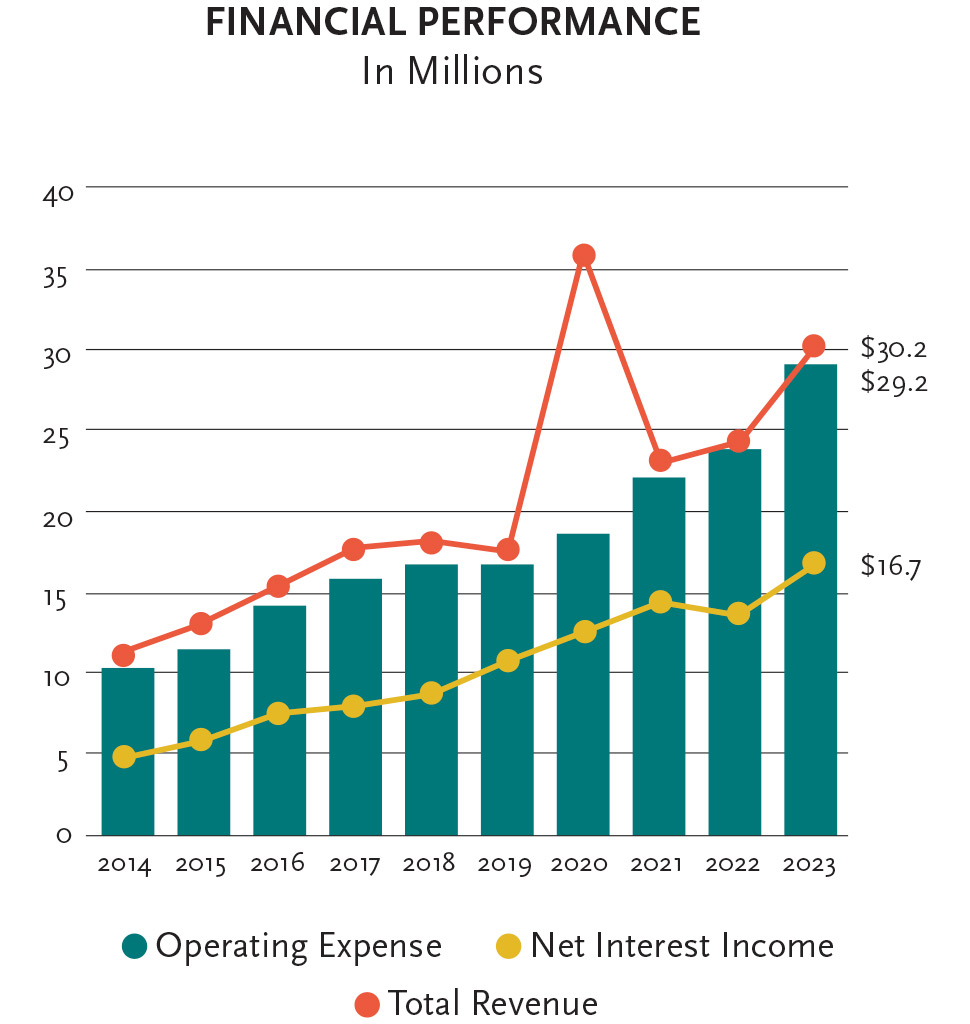
    The noticeable spike in our revenues in 2020 was due to a one-time major gift of $15 million from philanthropist MacKenzie Scott.
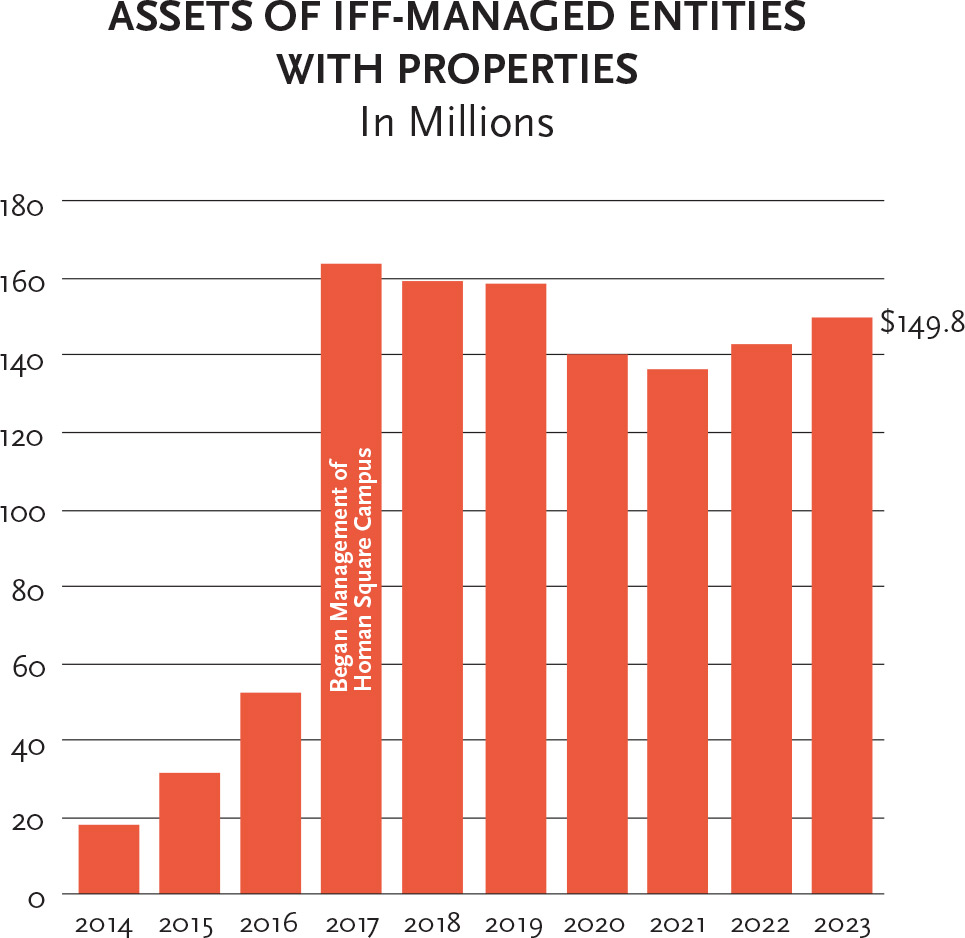
  • Managed Assets Data

    Strong nonprofits are essential to strong communities, and the ability of nonprofits to own their facilities is a key part of that equation. Most of the time, that’s where we start — our lending and consulting tools are designed to support nonprofits ready to own facilities.

    Sometimes, IFF will temporarily own facilities during a predevelopment or construction phase as permanent financing is acquired — or, a bit longer as operations stabilize — before transferring them back to local hands. Other times, and always at the direction of the community, IFF acts as a permanent, long-term owner where no other potential owner is present or ready, but the community demand for the facility is strong.

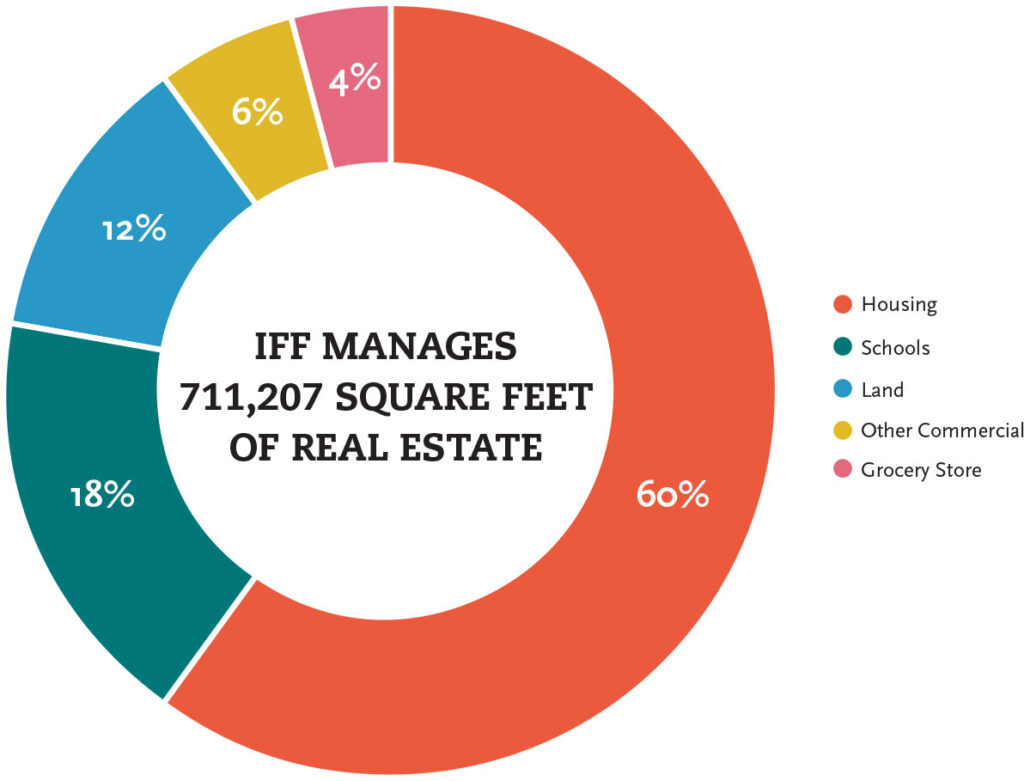
    IFF now owns and/or manages nearly three-quarters of a million square feet of real estate across our footprint.

  • Development Data – Community Development Solutions & Home First

    IFF serves as a real estate developer to launch community-driven projects. We work closely with community development partners to identify gaps where impactful projects would not happen through traditional development avenues. In 2023, driven by our equitable community development principles, IFF completed two project milestones and had seven projects under development, representing a total of over 155,020 square feet and more than $92.11 million in value.

    Completed in 2023
    Under Development
    # Projects
    2
    # Projects
    7
    # Projects
    Total Value of Projects
    $9.81 M
    Total Value of Projects
    $82.3 M
    Total Value of Projects
    Total Sq. Feet of Projects
    22,020
    Total Sq. Feet of Projects
    133,000
    Total Sq. Feet of Projects
    # Housing Units (not inc. sq. ft. total)
    120
    # Housing Units (not inc. sq. ft. total)
    145
    # Housing Units (not inc. sq. ft. total)
Partners »